
Infertility Statistics in the United States: What the Numbers Measure
The CDC estimated infertility at 8.5% among currently married US women ages 15 to 49 in its 2015 to 2019 data. Other groups, definitions, and survey periods call for other estimates. To read any US infertility rate, identify the population, the measured condition, and the data collection period.
How common is infertility in the United States?
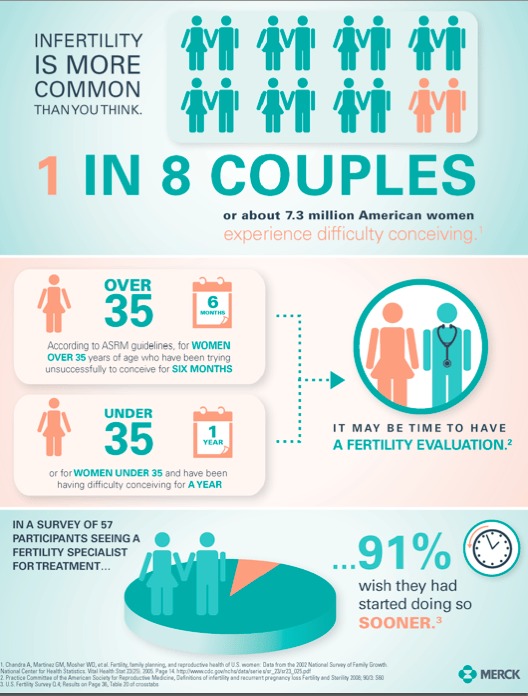
The CDC's infertility statistics report that 8.5% of currently married women ages 15 to 49 met its infertility measure in the 2015 to 2019 National Survey of Family Growth (NSFG). The same survey also tracks impaired fecundity, which covers any difficulty getting pregnant or staying pregnant. As a broader measure, it produces higher figures.
| Estimate | Measured outcome | Population | Data or report period |
|---|---|---|---|
| 8.5% | Infertility | Currently married US women, ages 15 to 49 | 2015 to 2019 NSFG |
| 13.4% | Impaired fecundity | All US women, ages 15 to 49 | 2015 to 2019 NSFG |
| 16.3% | Impaired fecundity | Currently married US women, ages 15 to 49 | 2015 to 2019 NSFG |
| 19.4% | Infertility, no previous births | Currently married US women, ages 15 to 49, without previous births | 2015 to 2019 NSFG |
| 11.4% | Male composite infertility measure | US men, ages 15 to 49 | 2015 to 2019 NSFG |
| 13.7% | Ever used any fertility services | US women, ages 20 to 49 | 2022 to 2023 NSFG |
| 8.9% | Lifetime infertility experience | US adults, weighted online sample of 1,000 | November 2024 survey |
| About 1 in 6 | Lifetime infertility experience | Worldwide population | WHO global report, 2023 |
The 8.5% and 16.3% figures both describe currently married women, but they measure different things. The 13.4% figure covers all women and uses the broader measure. These figures coexist because they measure different populations or outcomes.
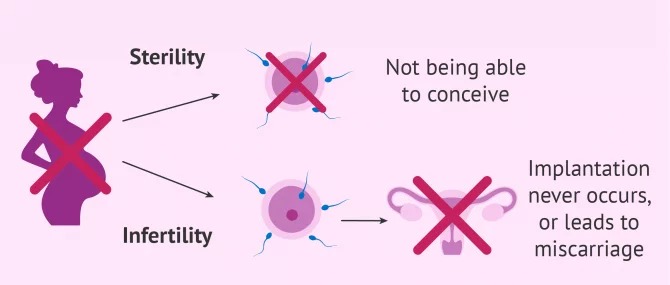
In the same NCHS series, 8.5% equals about 2.4 million women. The 13.4% impaired-fecundity figure equals about 9.7 million. The bigger count comes from the broader measure.
The Office on Women's Health gives another federal figure: about 10%, or 6.1 million women ages 15 to 44, with difficulty getting or staying pregnant. It uses a different age range and serves as general education.
What counts as infertility in these statistics?
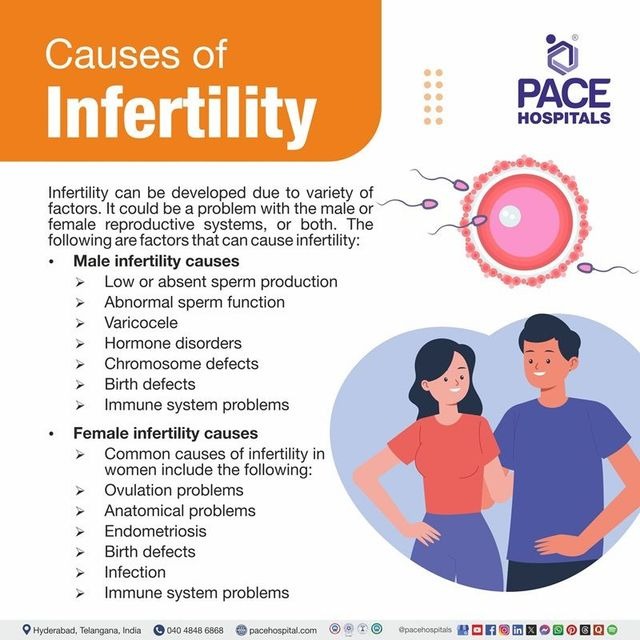
The NSFG defines infertility from survey answers about sexual activity, contraception, partnership, and pregnancy over a set period. For 2015 to 2019, a woman counts if she reported a continuous marriage or cohabiting partnership, intercourse at least monthly, no contraception, and no pregnancy over the preceding 12 months or longer. Surgical sterility is classified separately. The headline 8.5% uses the currently married subgroup.
This definition lets researchers count the same outcome the same way every time. It also means the NSFG figure covers a narrower group than everyone who has ever had a fertility problem.

Clinical infertility serves another purpose. The American Society for Reproductive Medicine (ASRM) bases its assessment on reproductive history, clinical findings, and circumstances that justify evaluation. Its definition covers cases that a survey's household and exposure criteria miss. Infertility, ovulation, and cycle timing are separate things; the menstrual-cycle overview explains normal cycle terminology.
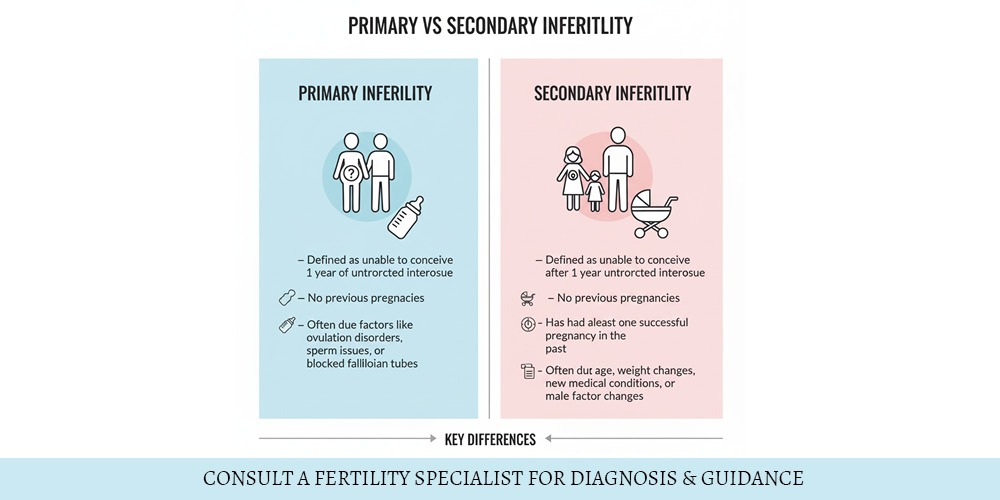
The familiar 12-month description belongs to that clinical context. ASRM guidance also supports earlier evaluation in some cases, including age and known reproductive risk factors.
Infertility does not mean permanent inability to conceive.
How do rates differ for women, men, and women with previous births?
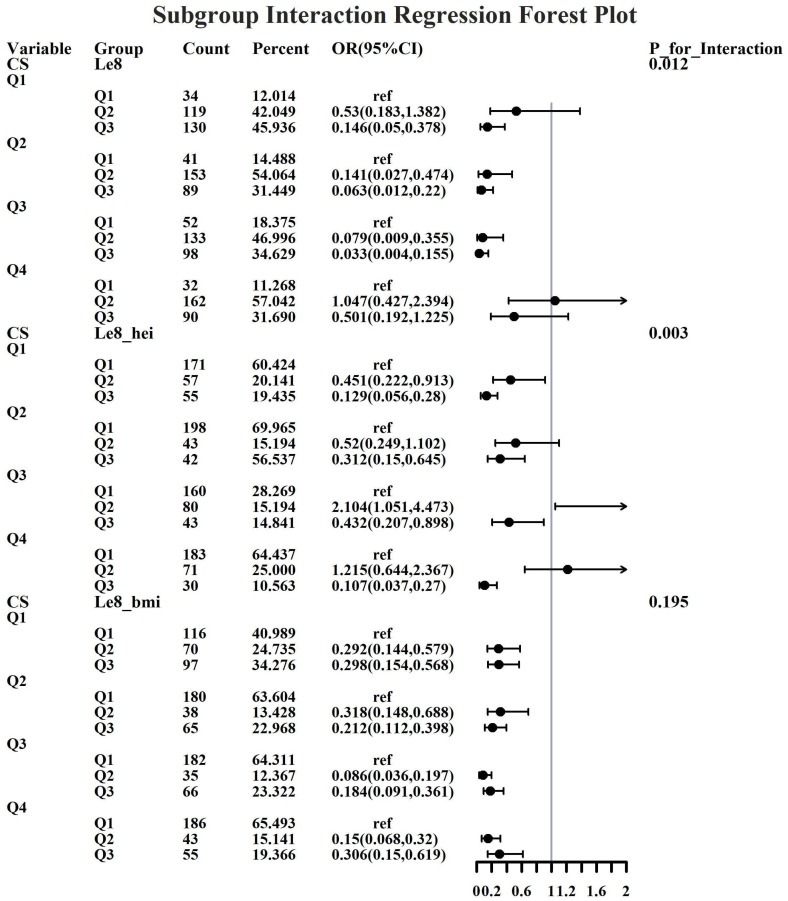
Previous births change which group an NSFG estimate describes; the survey also reports a male measure, built differently from the female one.
| Population | Estimate | What was measured |
|---|---|---|
| Currently married women ages 15 to 49, no previous births | 19.4% | Infertility |
| Currently married women ages 15 to 49, with previous births | 6.0% | Infertility |
| Men ages 15 to 49 | 11.4% | Combined measure of some form of infertility |
| NICHD educational estimates for men and women | About 9% of men; 11% of women | Fertility problems (NICHD's own figures) |
The 19.4% and 6.0% figures use the same female measure, so you can compare them. The gap is descriptive. The survey does not show that previous births cause it.
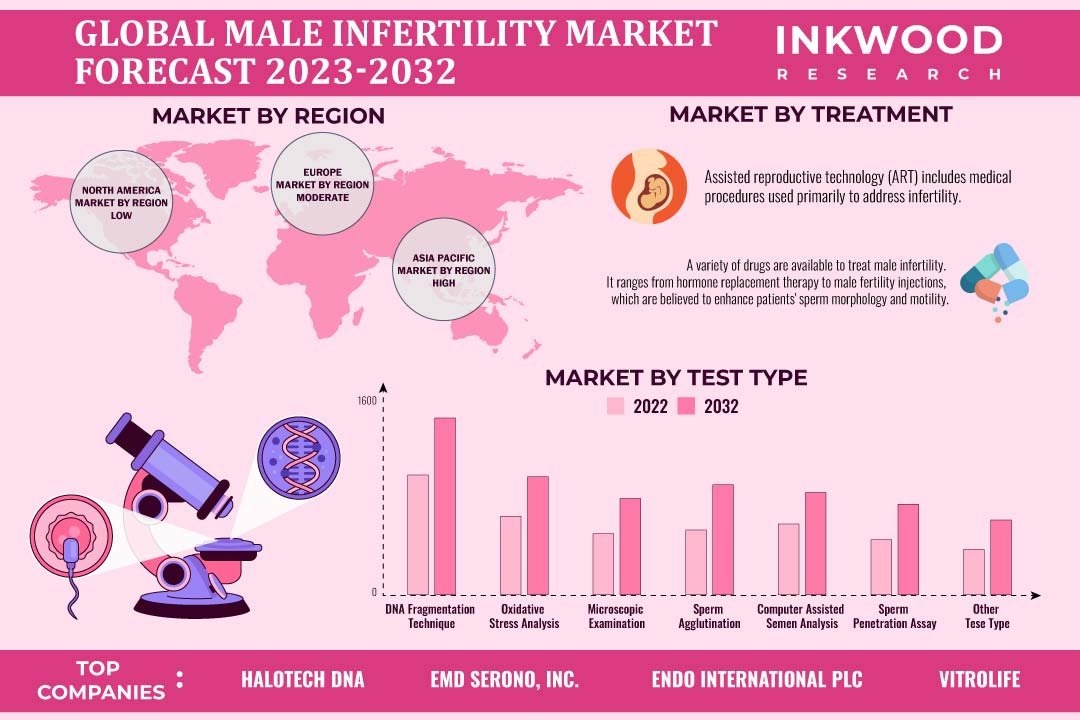
For men, the NCHS uses a composite measure of infertility or impaired reproductive capacity. You cannot compare it directly with the female 8.5% figure. The NICHD's estimates of about 9% and 11% come from their own source.
The NCHS analysis covered 21,441 interviews from the 2015 to 2019 NSFG, including 11,695 with women and 9,746 with men.
Is the WHO “one in six” figure the US infertility rate?

The World Health Organization's 2023 estimate is that roughly one in six people worldwide experience infertility during their lifetime. It covers the whole world over a lifetime. The CDC's US survey measures describe specific groups and observation periods, so the two cannot be compared directly.
Are newer infertility studies proof that US rates are changing?
A study's publication year and its data collection period can be years apart. A newer study may also use a different definition of infertility, so you cannot subtract its percentage from an earlier one.
A Journal of Women's Health study reported 8.9% lifetime infertility prevalence, with a 95% confidence interval of 7.2% to 11.0%, from a nationally weighted online survey of 1,000 US adults. It measured lifetime experience. The NSFG's 8.5% covers currently married women who meet a specific survey definition.
The journal study collected its responses in November 2024 and was first published online on July 8, 2026.
The confidence interval reflects statistical uncertainty in the study's estimate. It is not a range of fertility outcomes for any individual.
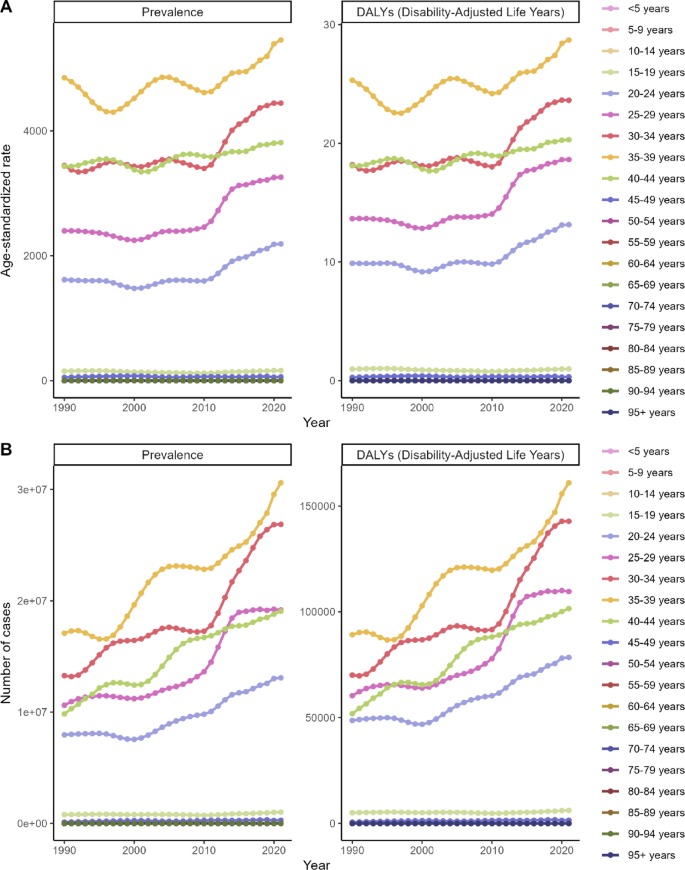
The NSFG does allow one comparison over time. In National Health Statistics Reports No. 202, the NCHS reports that infertility among currently married women ages 15 to 44 rose from 6.7% in 2011 to 2015 to 8.7% in 2015 to 2019. Impaired fecundity did not change significantly among comparable women ages 15 to 44, married women included.
That 8.7% covers ages 15 to 44. The 8.5% headline figure covers ages 15 to 49. Do not read 8.7% to 8.5% as a drop, and do not treat the two figures as interchangeable.
Are fertility treatment and testing statistics the same as infertility prevalence?
The National Center for Health Statistics also measures whether women have ever used fertility-related healthcare services. These figures report care and testing, so they are not infertility prevalence.
The 2022 to 2023 NCHS fertility-services brief reports the following percentages among US women ages 20 to 49:
| Service category | Ever used | What it includes |
|---|---|---|
| Any fertility service | 13.7% | Services related to becoming pregnant or preventing pregnancy loss |
| Medical help to become pregnant | 10.4% | Reported medical assistance with conception |
| Fertility testing | 6.9% | Infertility testing of the respondent or her partner |
| Assisted reproductive technology | 1.6% | IVF or other ART procedures |
The categories overlap. A woman might report both testing and treatment, so adding the four percentages would double-count. The 13.7% figure covers anyone who used any service.
What do national infertility statistics mean for your own chances?
National estimates describe groups of people. Questions about your own conception, a test result, or a treatment outcome need clinical information that these numbers do not contain.
Take the 19.4% figure for currently married women with no previous births. It describes how a survey group was classified. It does not give any one woman a 19.4% chance of failing to conceive.
Someone who has conceived before and is now struggling has a question shaped by personal history and examination findings. The national subgroup rates give background only.
If you have a personal fertility concern, talk with a qualified clinician about your medical history, your test results, and when to be evaluated. Do not wait on the NSFG's 12-month classification; ASRM's clinical guidance covers that decision.
How to verify an infertility statistic before repeating it
A number can be copied accurately and still mislead once its group is dropped. Five checks keep a US infertility statistic tied to what its source measured:
- Find the measured outcome. Is it infertility, impaired fecundity, lifetime experience, or use of fertility services?
- Read the population label. Note the age range and any conditions such as marital status or previous births.
- Confirm the geography. Is it the United States, a narrower US subgroup, or worldwide?
- Locate the data period. Separate the survey years from the publication date.
- Trace the original method. Find the table, definition, study design, and any uncertainty or exclusion notes.

Suppose a graphic says, “19% of US women are infertile.” The CDC figure behind it covers currently married women ages 15 to 49 who have not previously given birth, in the 2015 to 2019 NSFG. That description changes what the sentence means.
Use the estimate that matches your question if your population, definition, or survey period differs.